
Application Insights telemetry for Dynamics 365 Finance & Supply Chain takes about 15 minutes to configure, and data starts showing up in the log within 5 to 10 minutes of saving. That's the entire barrier to entry for the same usage data we use to right-size licenses and check which duties people are actually touching, not which duties their role happens to grant.
Everything below comes from a walkthrough we ran end to end on a live F&SC environment: the Azure setup, the two configuration screens inside F&SC itself, the KQL to query the log, and the real cost math against Microsoft's free tier.
What telemetry actually captures
Telemetry is a resource inside Application Insights. It's Azure's built-in way of capturing runtime signals for the F&SC application and its services, automatically, without adding logging anywhere by hand. Here's what it captures out of the box:
- Requests coming in
- Response times
- Exceptions
- Dependency calls (database or API calls)
- Custom events you choose to track
All user activity gets recorded as data inside this same Application Insights log. That's the part that matters for licensing and security work: it's a queryable record of what people actually did, not a guess based on which security role they were handed.
What it actually costs
Application Insights gives you 5 GB of data ingestion free every month, and F&SC events typically run 2 to 10 KB each, 32 KB at the high end. At a 10 KB average, that free tier works out to roughly 166 MB a day, about 16,600 events a day before anything starts costing money.
| F&O active users | Est. events / month | Est. events / user / day |
|---|---|---|
| 100 | 100,000-200,000 | ~33-67 |
| 300 | 400,000-500,000 | ~44-56 |
Beyond the free tier, pay-as-you-go pricing runs $2.76 per GB. At a 10 KB average event size, that's roughly 100,000 events per GB, or about $0.0000276 per event, which works out to $2.76 per 100,000 events. Rates vary slightly by Azure region, so check the current rate for yours before you lock in a cost estimate.
Most tenants with a few hundred active F&O users or fewer stay entirely inside the free 5 GB a month tier. Telemetry for license and activity analysis often ends up costing nothing at all.
Data retention
Application Insights retains data for 90 days by default, included in the ingestion price, so there's no extra charge for standard retention. You can extend that up to 730 days, two years, but anything held past the 90-day window costs extra per GB per month. If you need to consume telemetry continuously instead of querying it in batches, Fabric's Eventstream can pull it directly from the underlying Event Hub.
Create the Application Insights resource
Start in the Azure portal. Search for Application Insights, and either open an existing resource or create a new one.
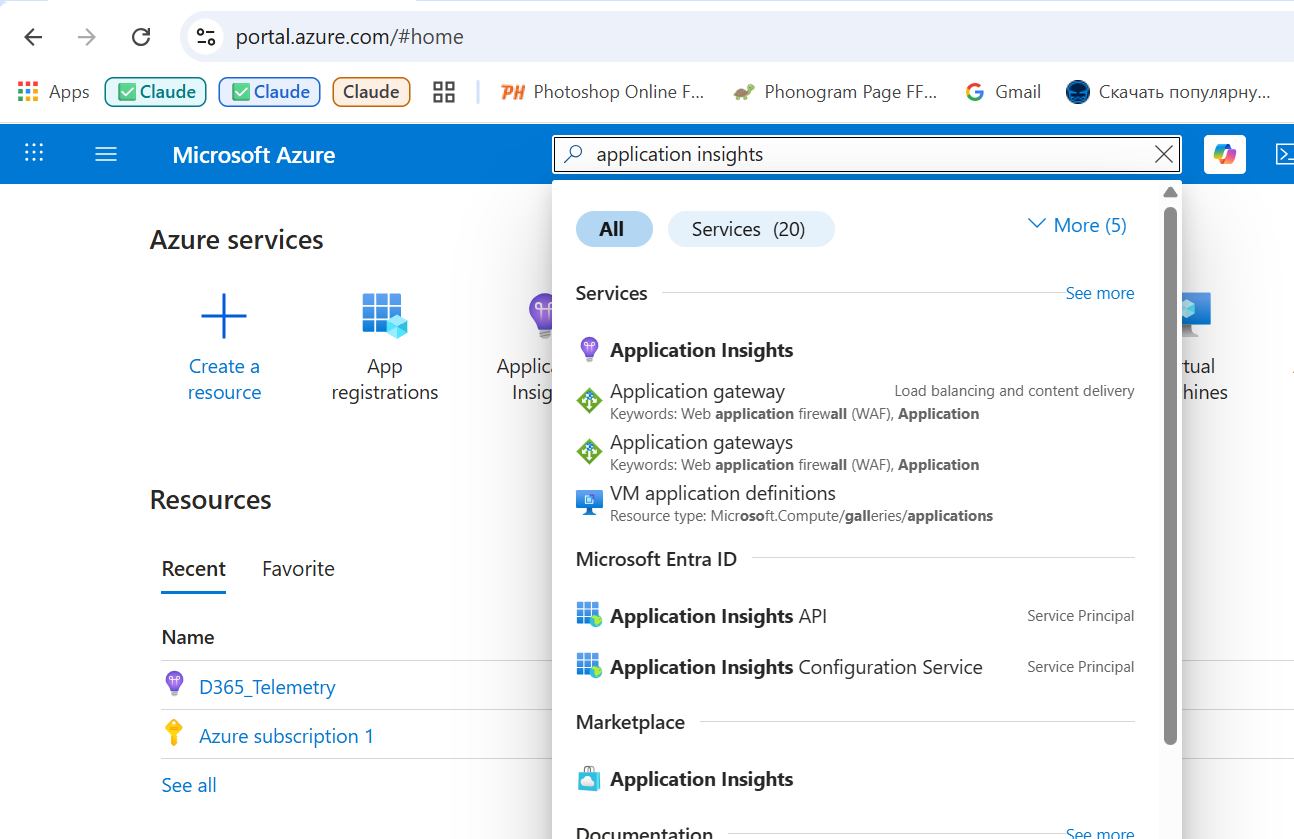
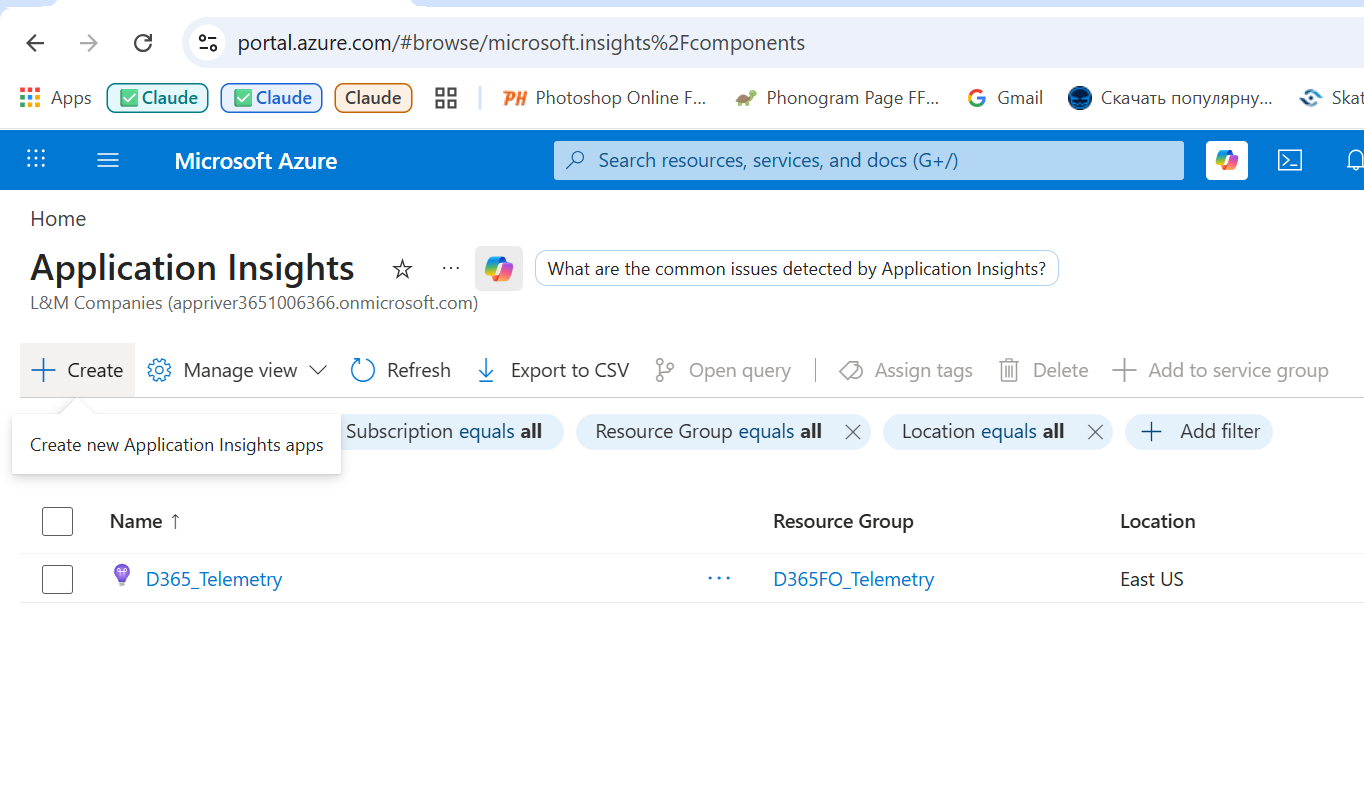
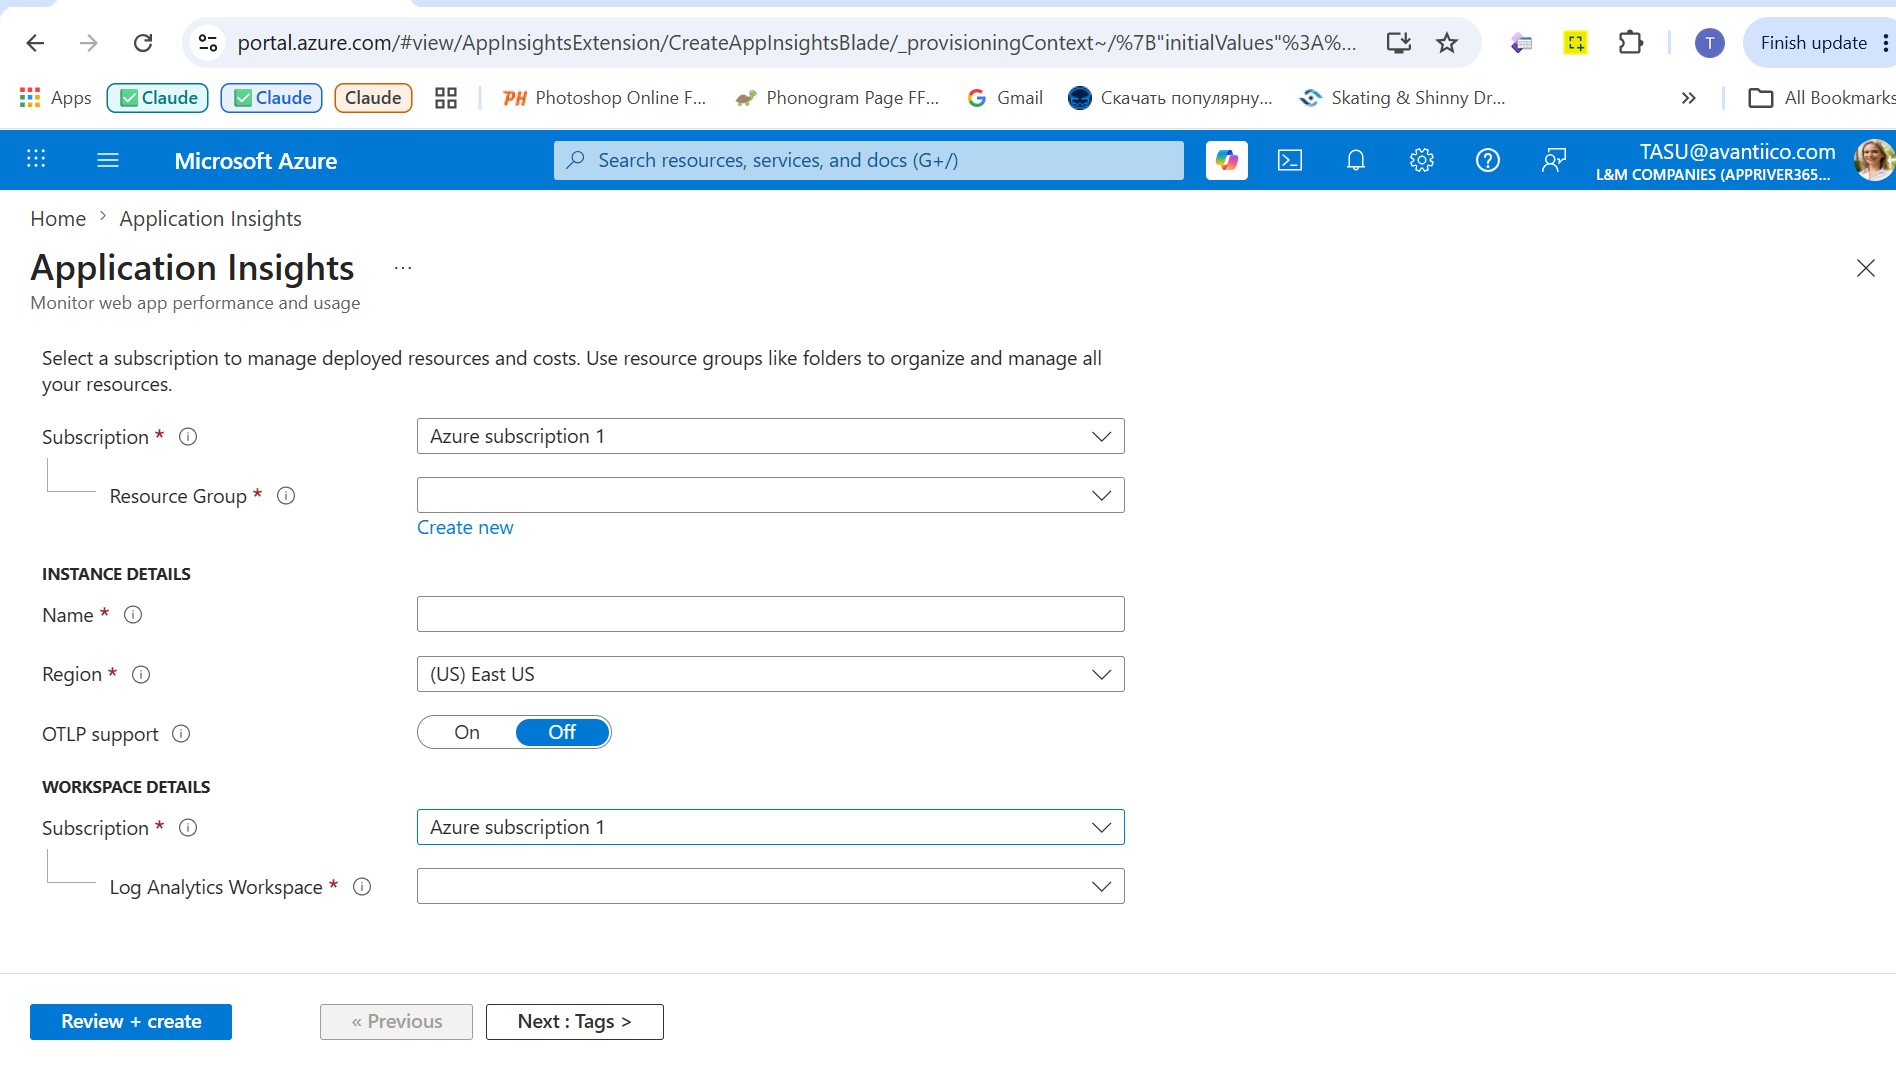
On the create form, select a subscription and resource group, give the resource a name, and pick a region. Leave OTLP support off unless you specifically need it, and either reuse an existing Log Analytics Workspace or create a new one. Provisioning takes about 2 minutes.
Capture three parameters
Once the resource exists, its Overview page shows two values you'll need: the Instrumentation Key and the Connection String. Both have a copy-to-clipboard button next to them.
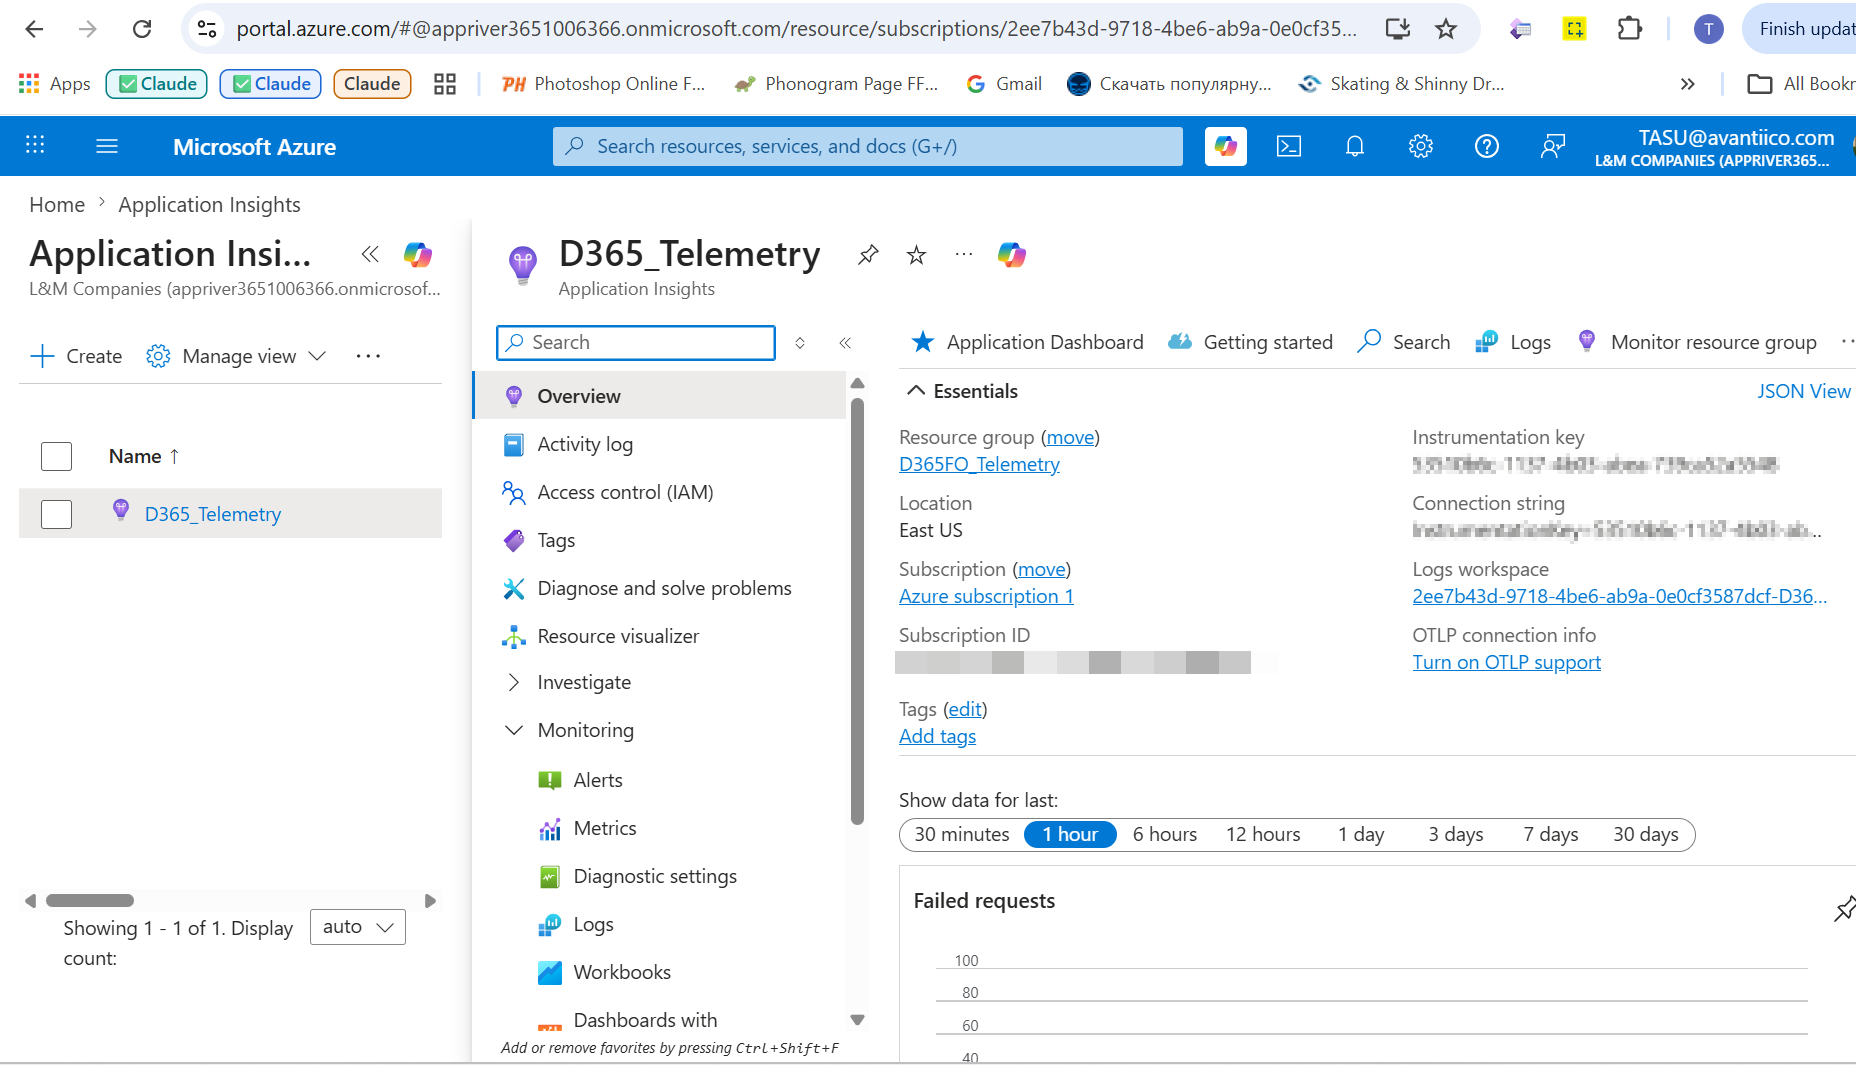
The third parameter, the Environment ID, comes from Lifecycle Services (LCS). Open the project the environment belongs to, go to environment details, and copy the Environment ID shown there.
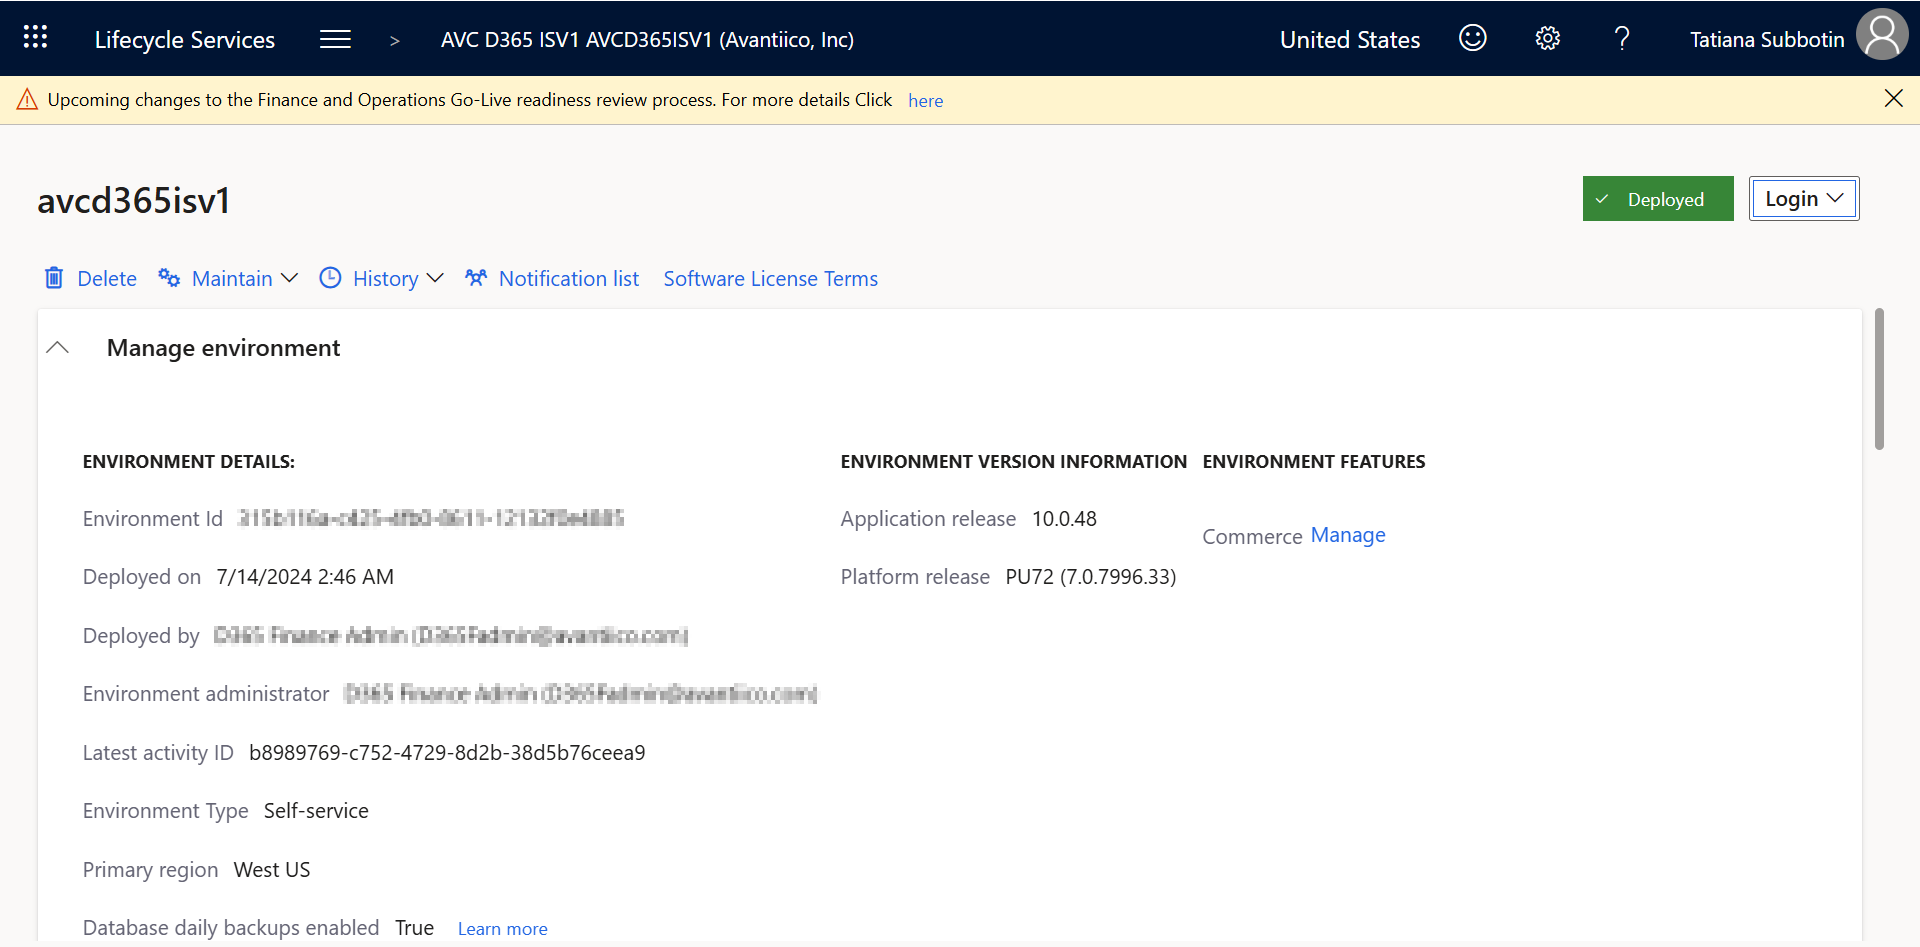
The instrumentation key and connection string aren't user credentials, but they can be used to write telemetry into your Application Insights resource from anywhere. Don't paste them into tickets, chat, or screenshots that leave your organization. Blur or crop them the way we did above.
Turn on the right parameters in F&SC
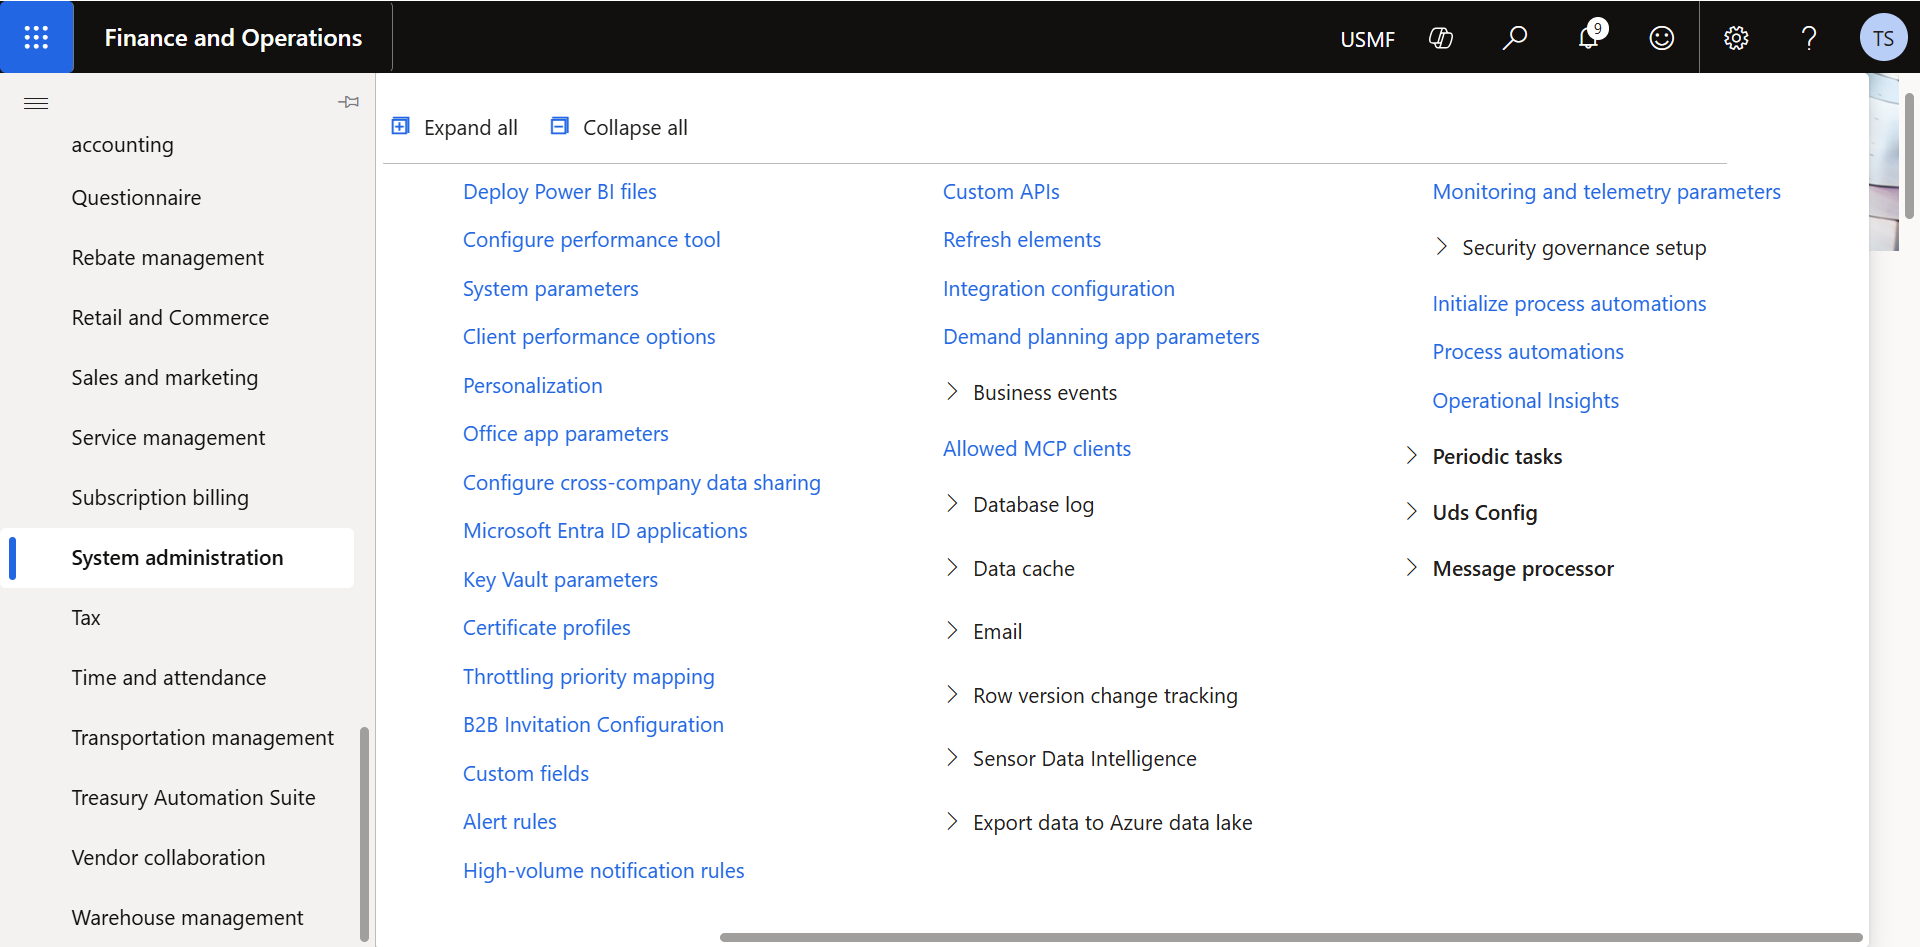
Inside F&SC, the configuration screen is under System administration → Setup → Monitoring and telemetry parameters.
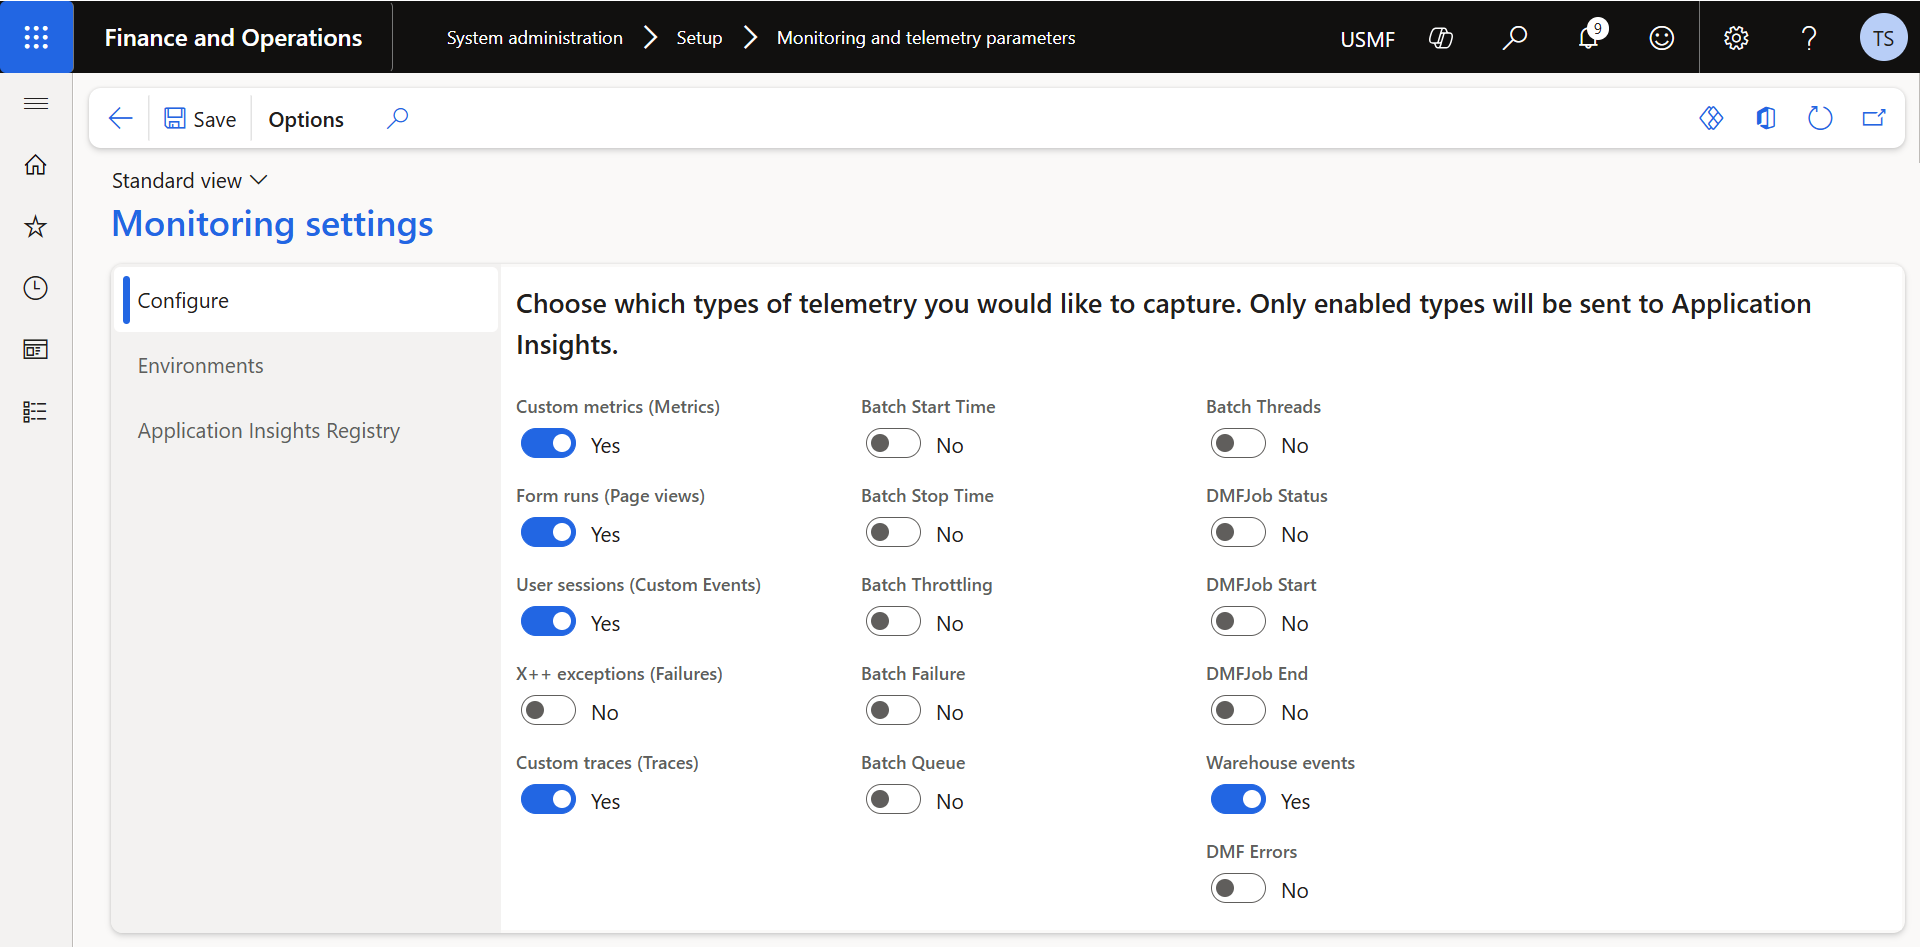
The Configure tab lists every event type F&SC can send. Turning more on isn't free, since each additional flag burns through free-tier capacity faster, so we only enable what's needed for user-activity and license analysis:
- Custom metrics (Metrics)
- Form runs (Page views)
- User sessions (Custom Events)
- Custom traces (Traces)
- Warehouse events
Everything else stays off unless a specific investigation needs it: X++ exceptions, the Batch* fields, DMFJob* fields, DMF Errors.
Map environments and register the key
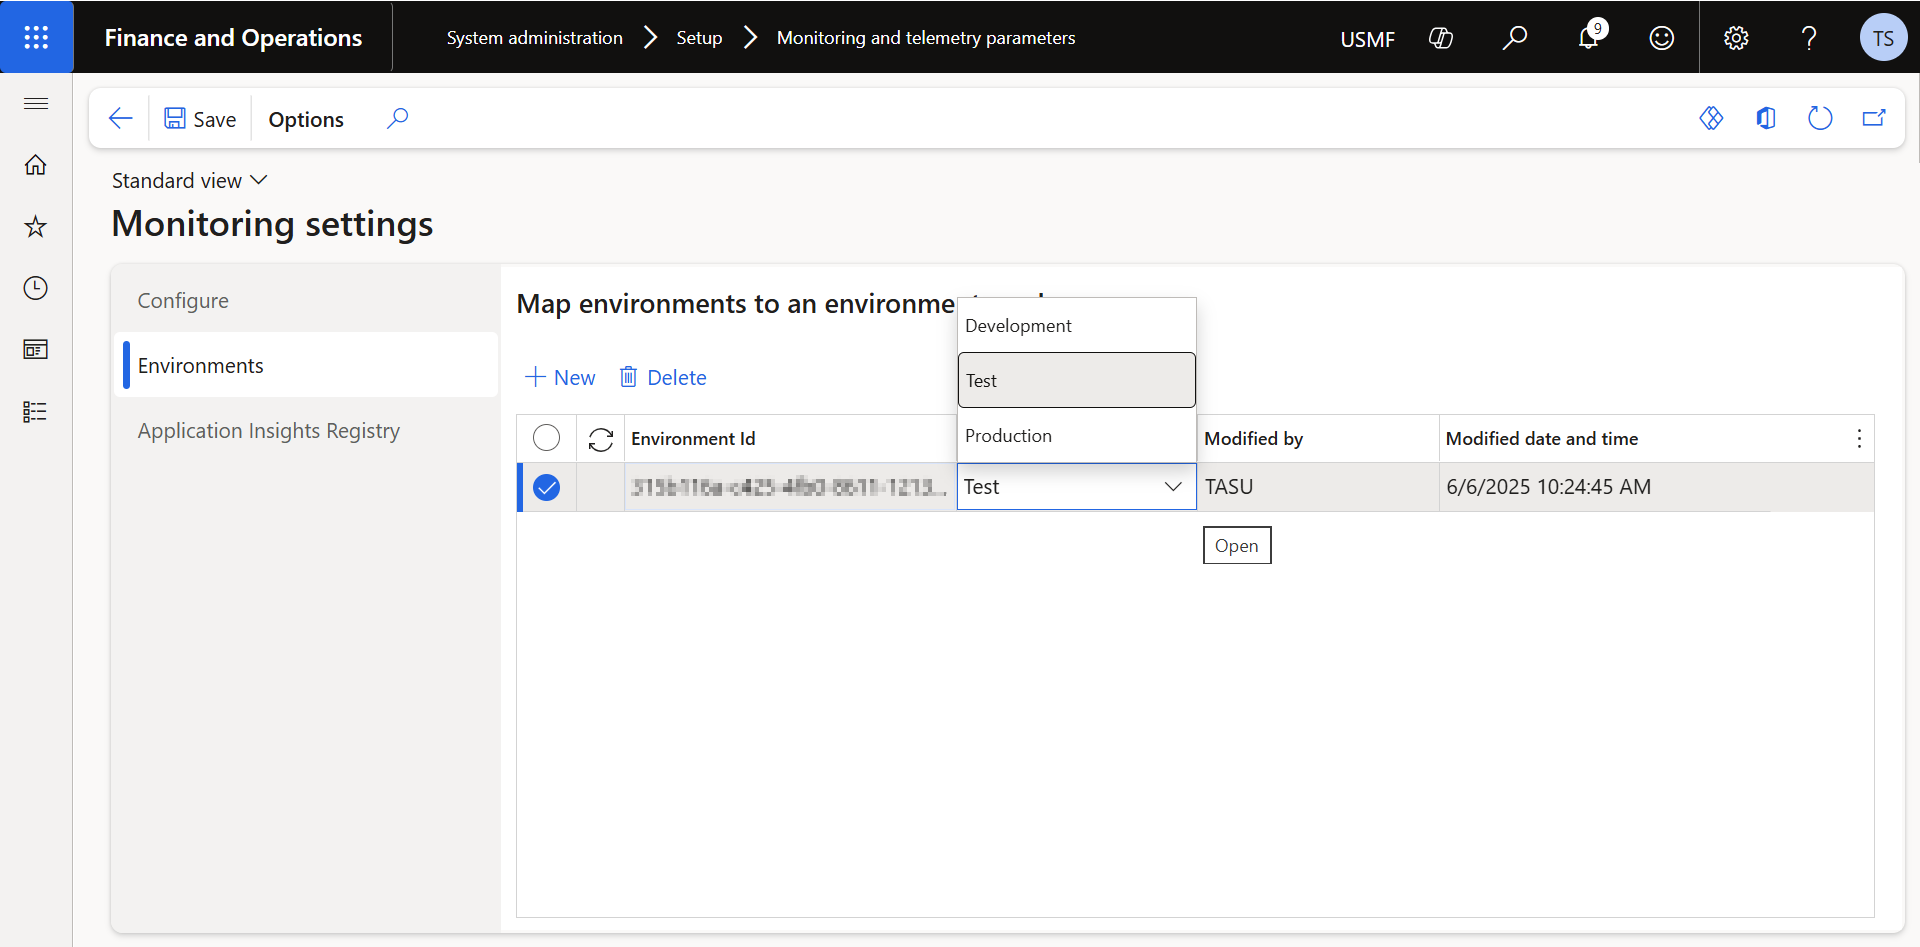
Two more tabs on the same page. Environments maps each environment ID to a type, Production, Test, or Development, so you can tell later which environment a given telemetry row came from. Test covers UAT, sandbox, and any tier-2-plus environment. Development covers tier-1.
Application Insights Registry is where the instrumentation key and connection string actually get pasted in, mapped to the same environment type. Microsoft's own description of this screen is worth knowing verbatim: if a database is copied from one environment to another, the mode is auto-detected and fails over to the new target endpoint; if an environment isn't mapped at all, it defaults to DEV mode.
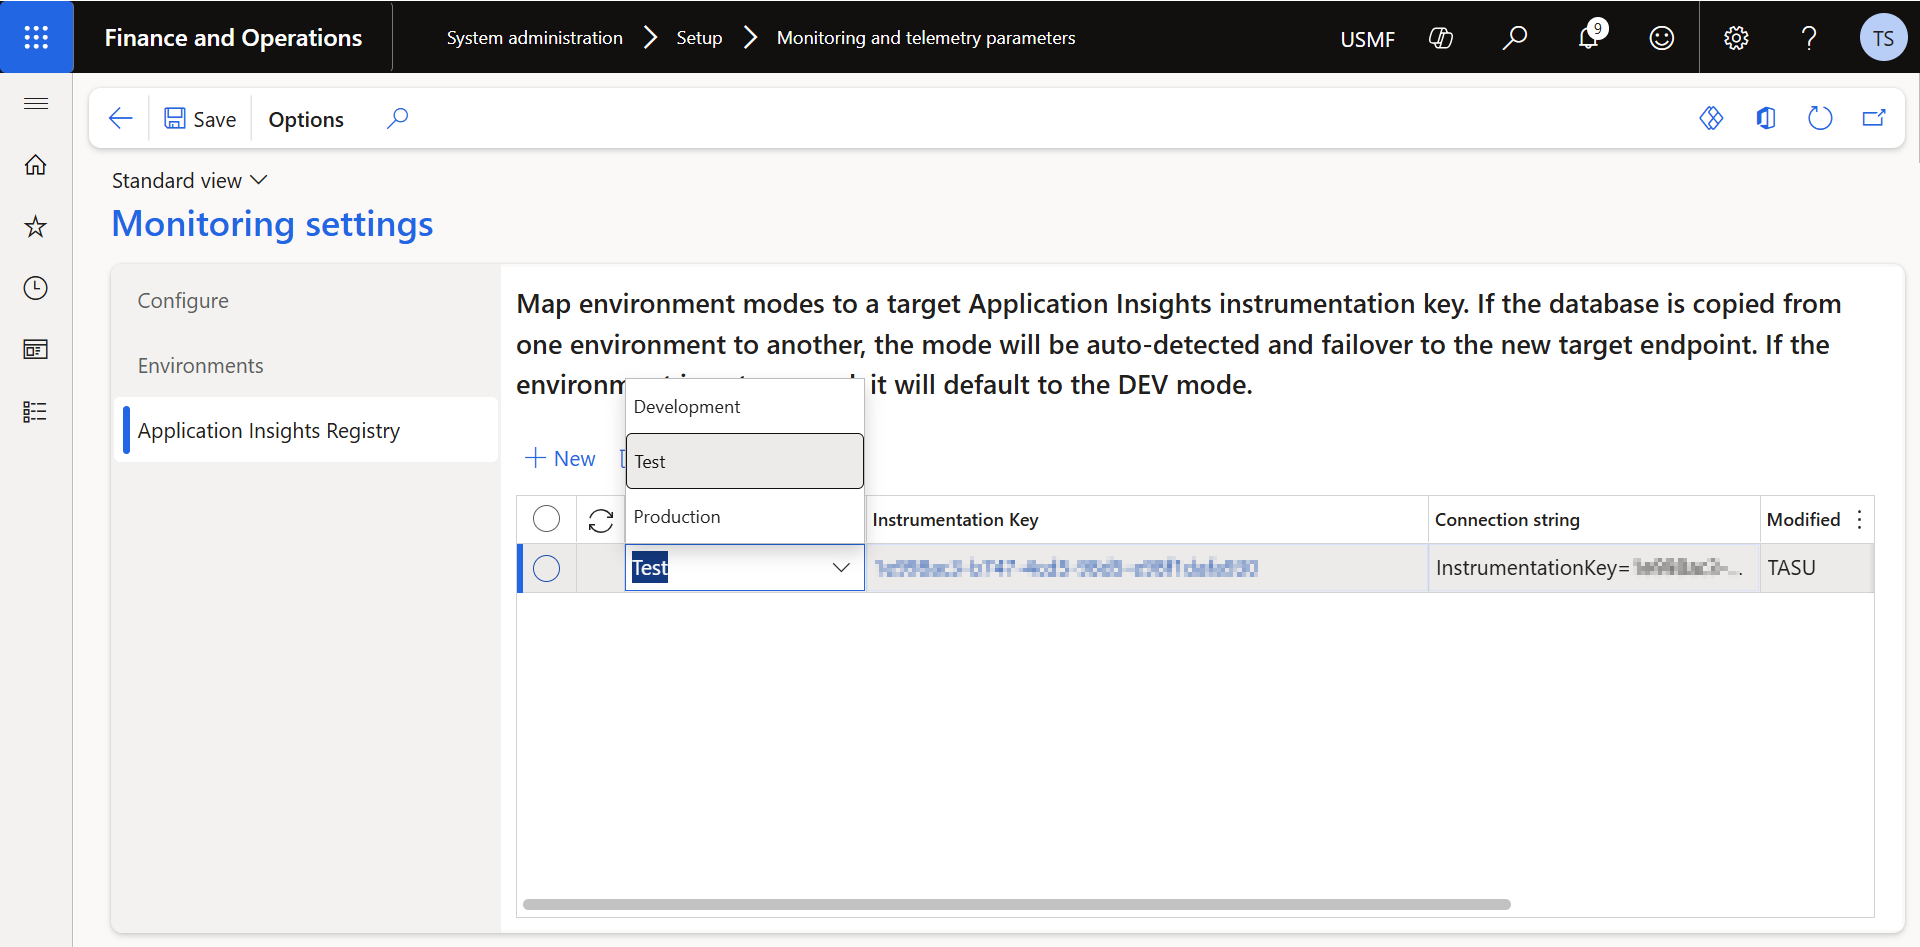
Save, and data starts registering in the Application Insights log within 2 to 5 minutes.
Query the log
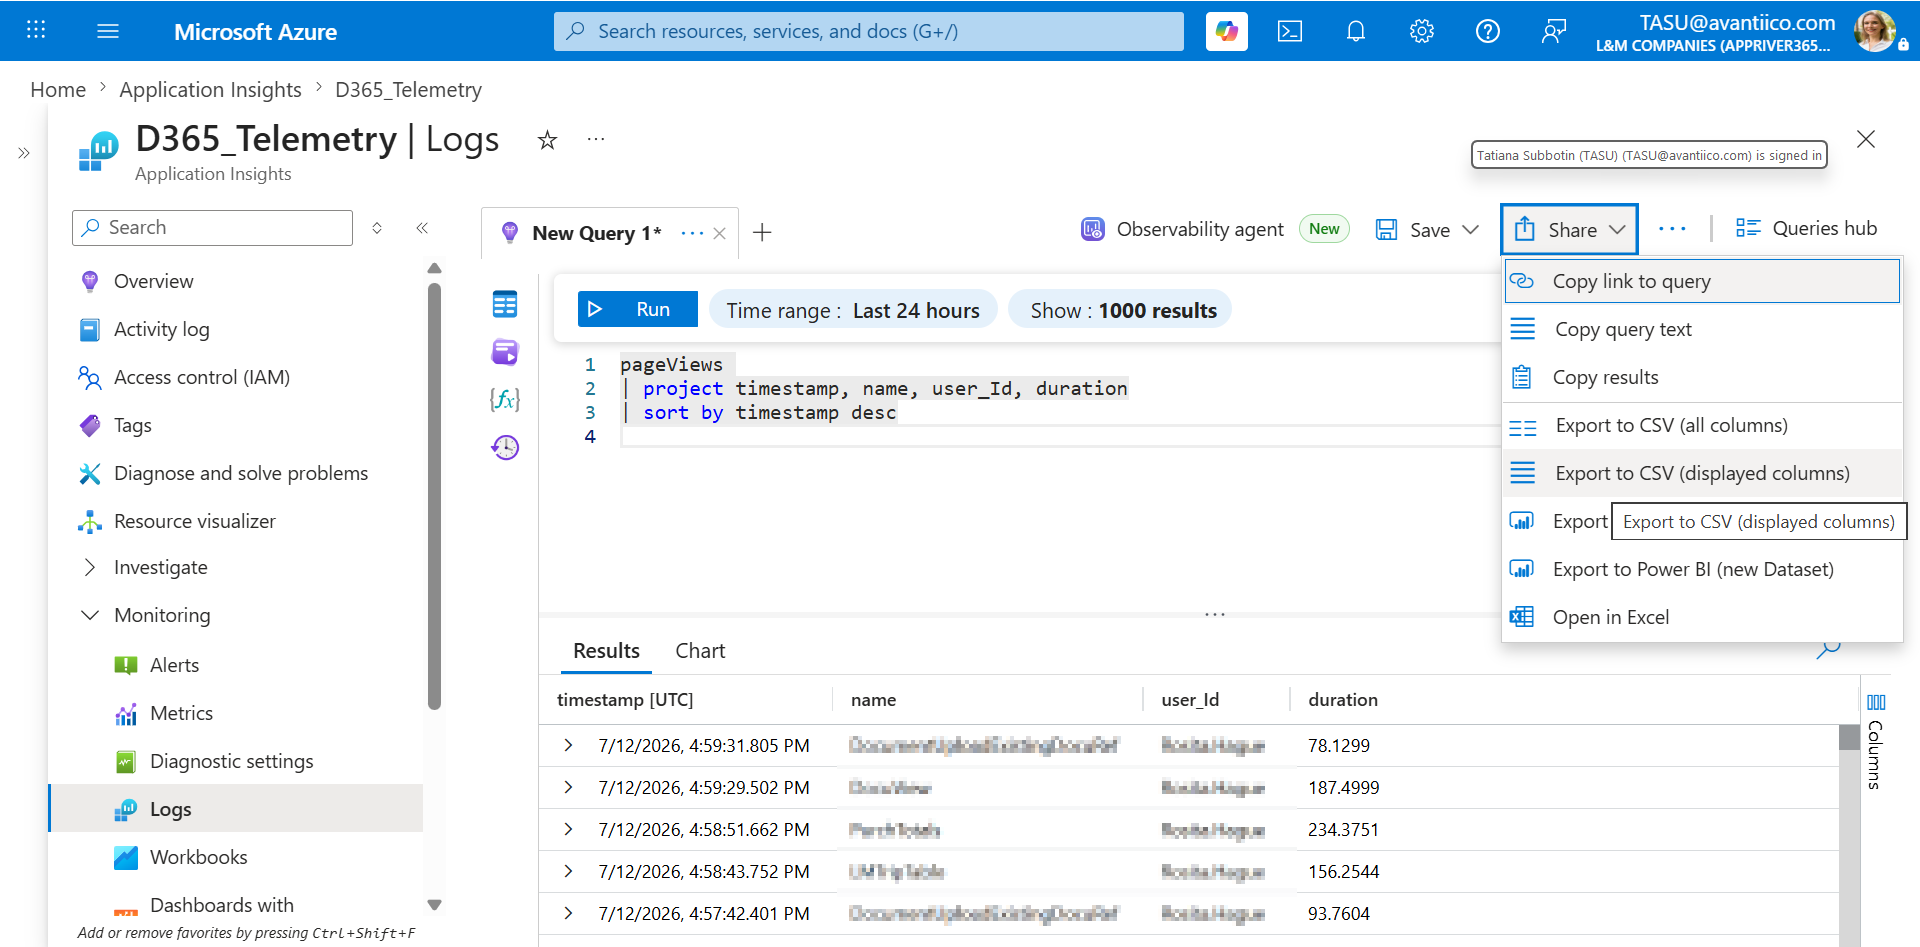
Back in the Azure portal, open the Application Insights resource, expand Monitoring → Logs, and switch the query editor from Simple mode to KQL mode.
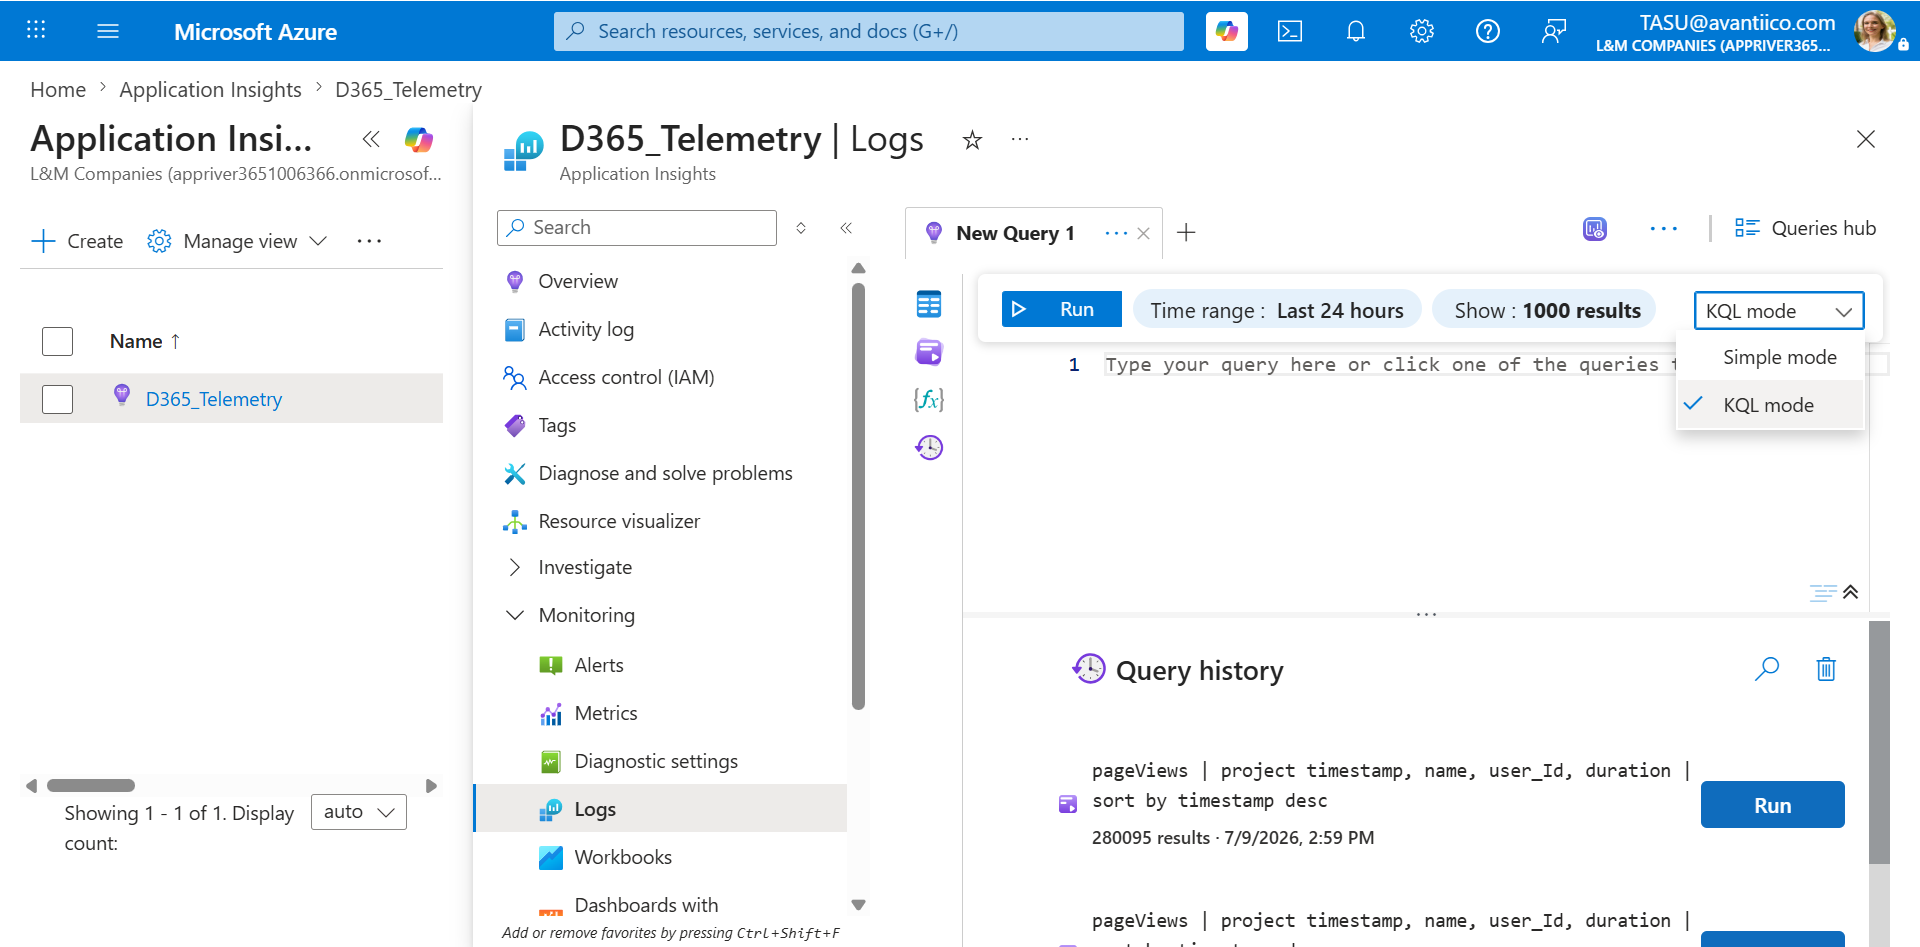
Two scripts cover most user-activity analysis. If you're only pulling from a single environment, the short version is enough:
pageViews
| project timestamp, name, user_Id, duration
| sort by timestamp desc
If you're comparing activity across two or more environments, extend it to carry the environment ID through:
pageViews
| extend environmentId = tostring(customDimensions['environmentId'])
| project timestamp, name, user_Id, duration, environmentId
| sort by timestamp desc
Set the time range and export
Before running the query, set the time range. Presets cover anywhere from the last 30 minutes up to the last 7 days, or use a custom from/to range for anything longer.
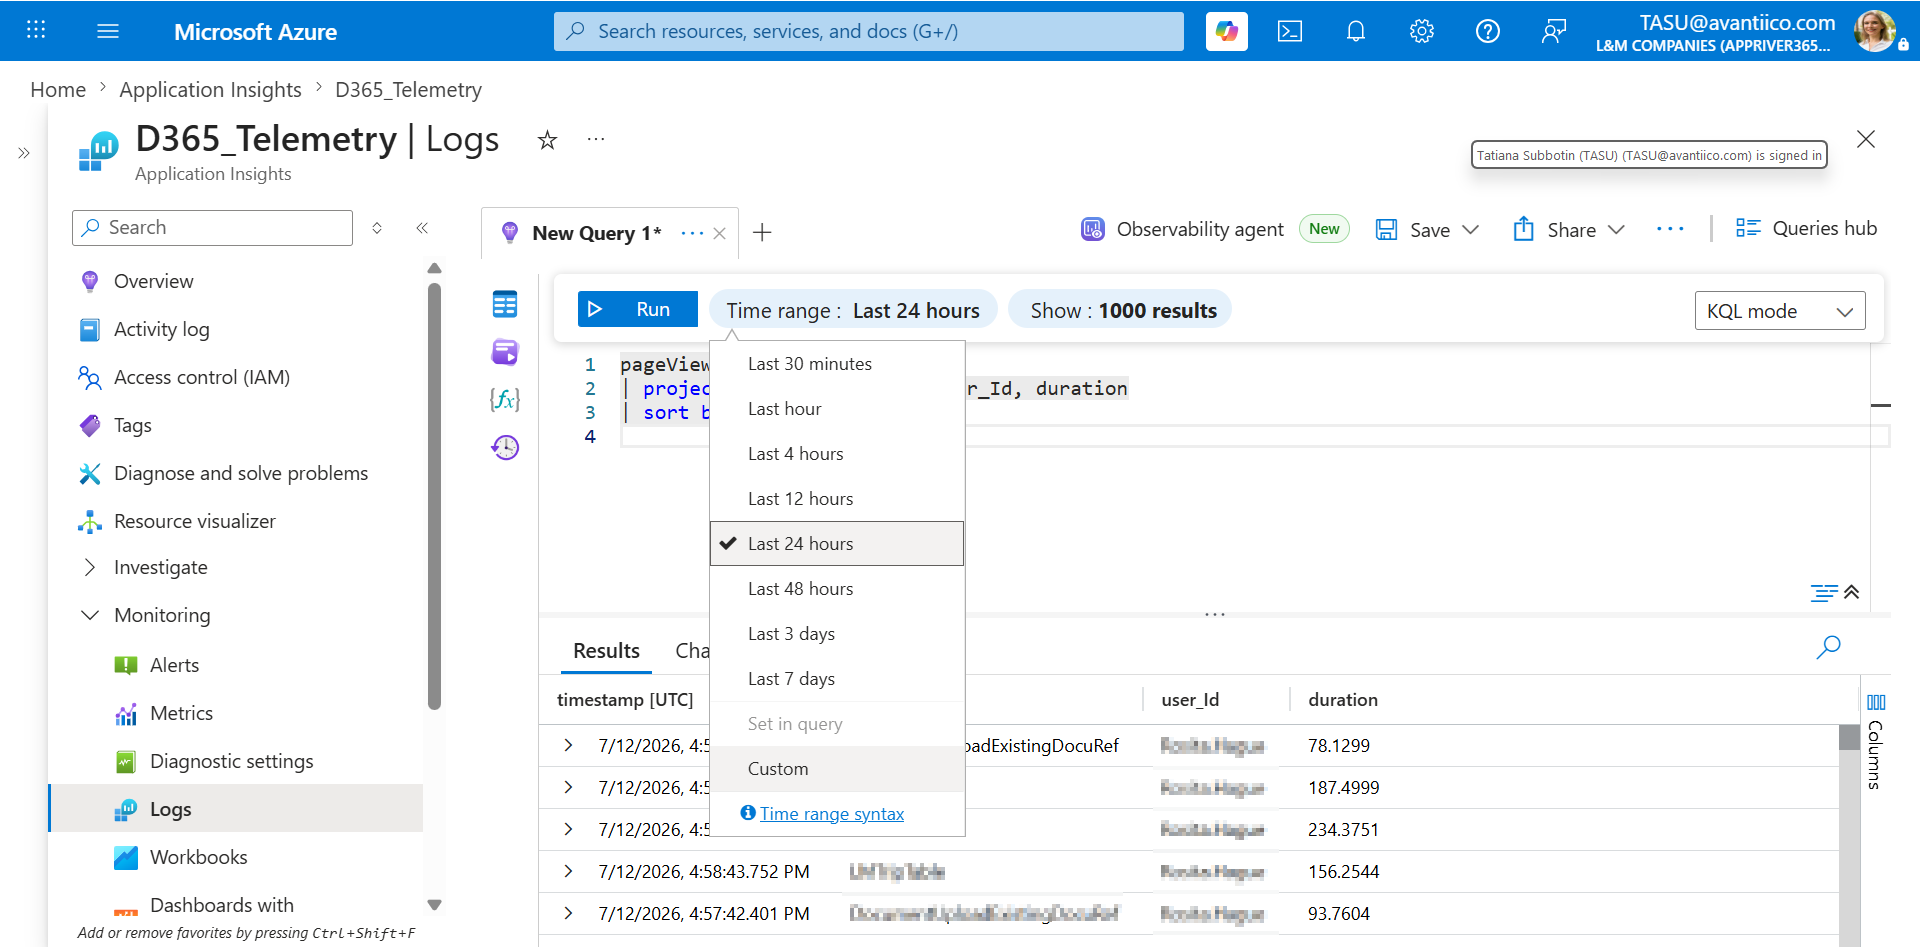
A single query run is capped at 500,000 rows, and the underlying data only goes back roughly 90 days, the same retention window from step 03. Plan a custom range accordingly if you're pulling a full quarter.
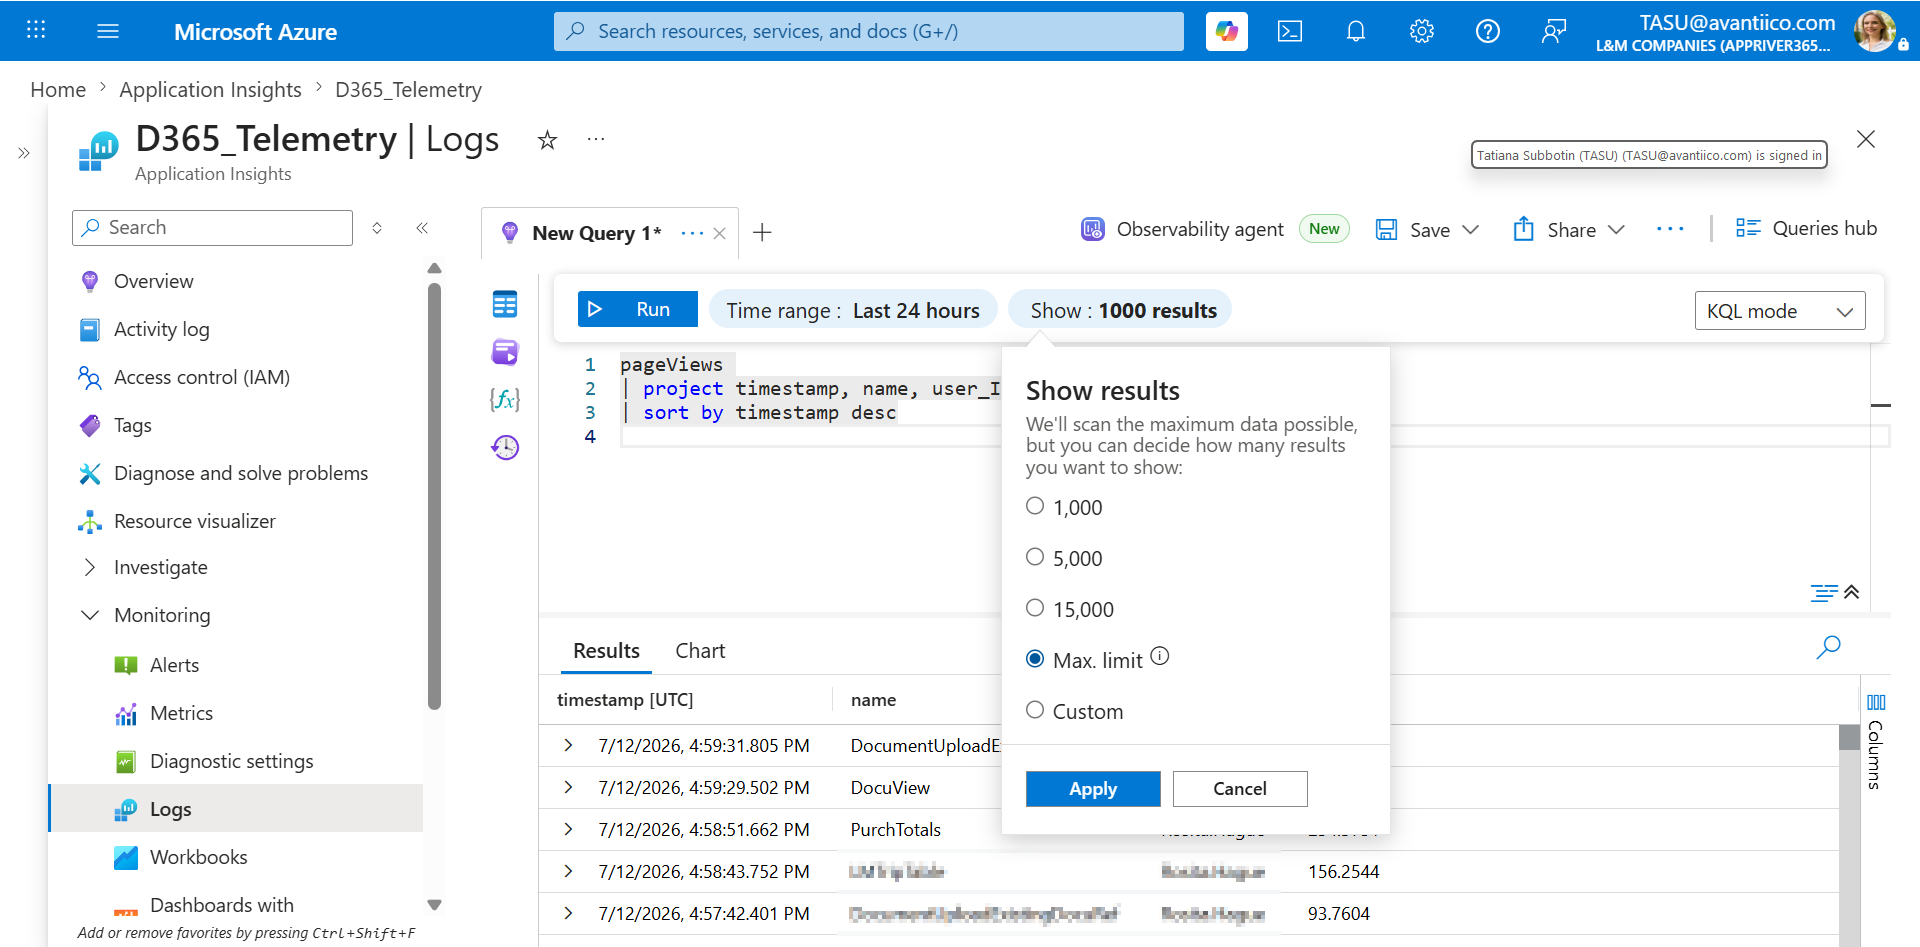
Once the results come back, export from the Share menu. Use Export to CSV (displayed columns) rather than "all columns": it keeps the export scoped to exactly the fields your query selected, which is what you want for a clean analysis file.
Fifteen minutes of Azure configuration is what separates a licensing or security review that estimates usage from one that measures it. Every form, session, and duty becomes a queryable row instead of an assumption.
This is the same usage signal behind the security-model work we describe in how we build an optimized security model from telemetry rather than job titles, and it pairs directly with the overbuying patterns covered in D365 F&SC Licensing 101: telemetry tells you what a user actually touches, and the licensing guide tells you what tier that requires. It's also the second data source behind identifying inactive users, the overlicensing fix that saves the most of any single strategy.